BI built for
agents
With Graphene, agents do the busy work of querying and visualizing data so you can ask 10x more questions.

Rooted in code
Models, dashboards, queries, and other tools are all backed by code and CLIs, which agents do best with. Lives in your repo. Open source.
See example project → delay_factors.md
---
title: What makes your flight late?
layout: notebook
---
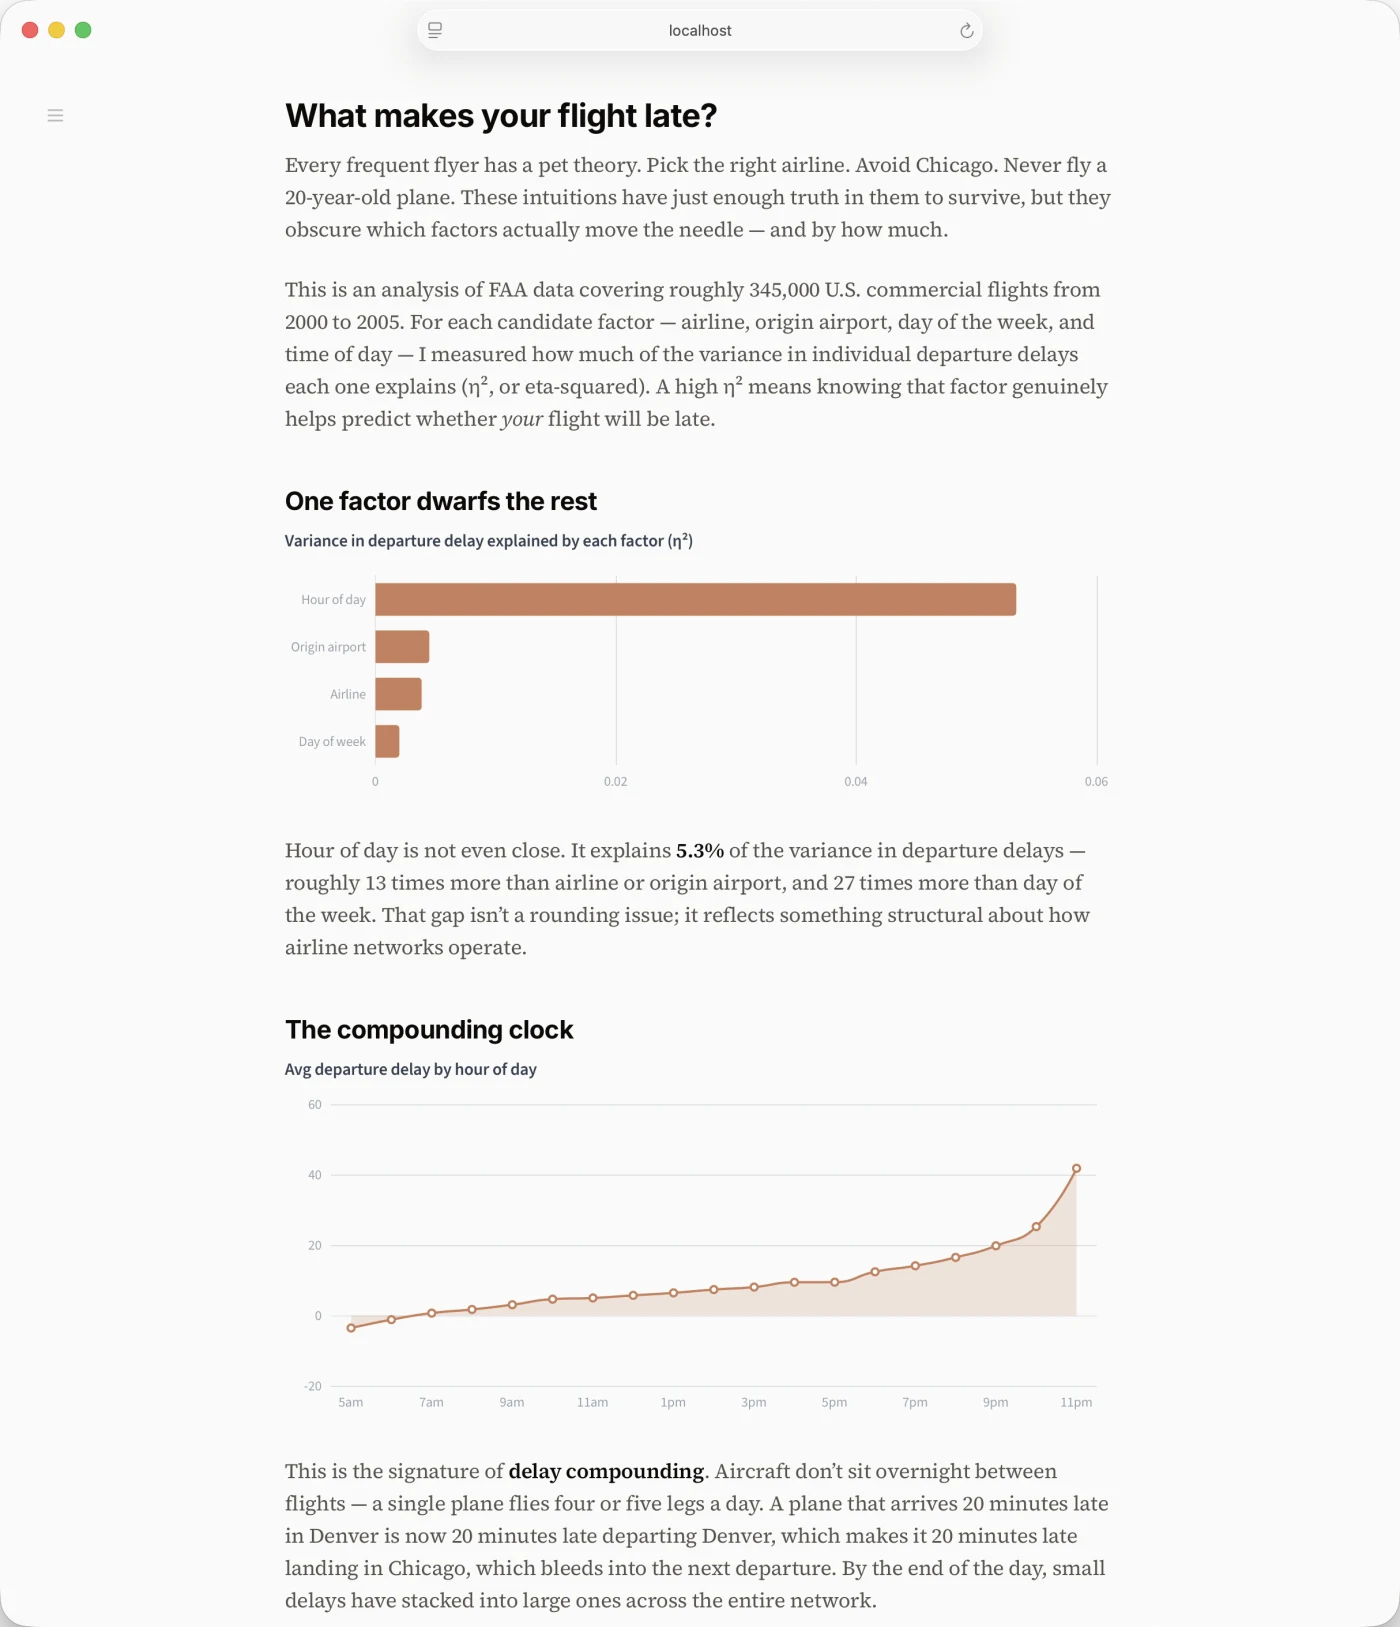
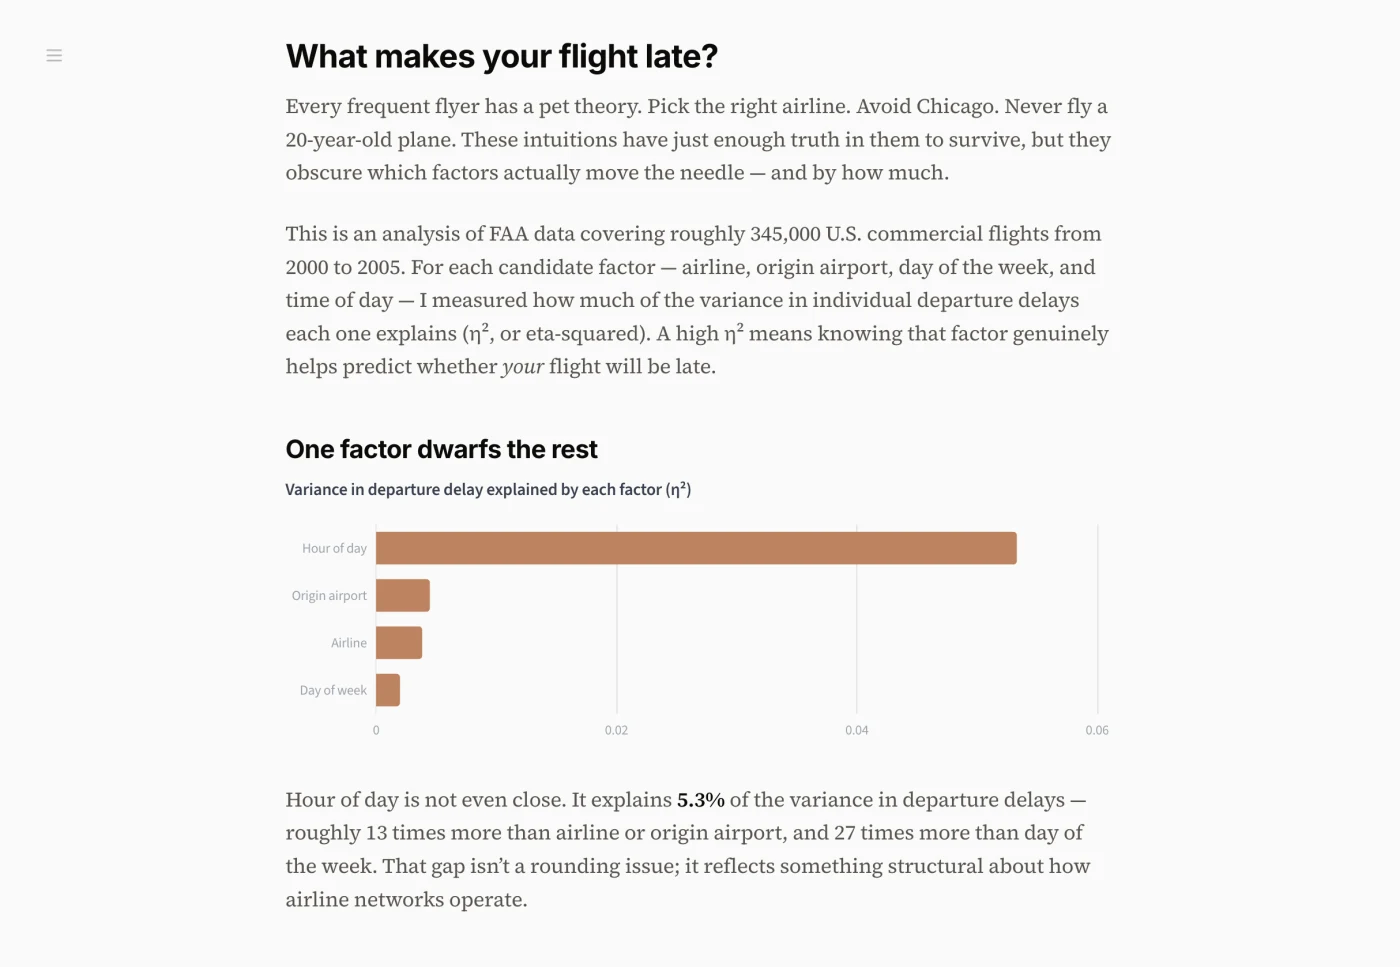
Every frequent flyer has a pet theory. Pick the right airline. Avoid Chicago. Never fly a 20-year-old plane. These intuitions have just enough truth in them to survive, but they obscure which factors actually move the needle — and by how much.
This is an analysis of FAA data covering roughly 345,000 U.S. commercial flights from 2000 to 2005. For each candidate factor — airline, origin airport, day of the week, and time of day — I measured how much of the variance in individual departure delays each one explains (η², or eta-squared).
## One factor dwarfs the rest
```gsql factor_importance
with
info as (
from flights where cancelled = 'N'
select avg(dep_delay) as grand_mean, var_pop(dep_delay) * count() as ss_total
),
hour_groups as (
from flights where cancelled = 'N' and extract(hour from dep_time)::integer between 5 and 23
select extract(hour from dep_time) as grp, count() as n, avg(dep_delay) as grp_mean
),
...
Fully steerable
Agent skills allow you to customize agent behavior based on your unique data and business processes. Graphene follows the open standard skill format.
cohort-analysis/SKILL.md
---
name: cohort-analysis
description: Performs cohort analysis for customer behavior patterns over time. Use when analyzing retention, LTV, or other metrics by customer cohorts, or when the user asks about cohorts, retention curves, or customer lifecycle patterns.
---

# Cohort Analysis

Users expect cohort analysis to look a certain way. This guide walks through it.

## Query Pattern

Always group by two dimensions:
1. **Cohort period**, e.g., the month a user's subscription starts
2. **Elapsed time units**, e.g., the number of months that have elapsed since the subscription started

Then aggregate the target metric(s). Filter to the last 12 months if not specified otherwise.

## Visualization Options

### Option 1: Multi-Series Line Chart
...
about-sales-team/SKILL.md
---
name: about-sales-team
description: How to perform analytics for sales and GTM-related areas
---

# Sales

## Overview

The sales team is broken down into sub-teams for inbound sales, outbound sales, and enterprise sales. The Enterprise Sales owns all accounts at the enterprise level (>1,000 employees) and includes both the inbound and outbound directions for this level.

We use Salesforce to manage our sales operations. The most important tables are `dim_salesforce_opportunities` and `dim_salesforce_accounts`.

## Key Concepts

### Opportunity Types
* **New Business:** First-time purchase by a new account.
* **Expansion:** Upsell or cross-sell to an existing account.
* **Renewal:** Continuation of an existing contract.

### Business Sizes
* **SMB:** <100 employees.
* **Mid-Market:** 101 - 1,000 employees.
* **Enterprise:** >1,000 employees.

## Glossary of terms
...
The semantic layer, reimagined
Introducing GSQL: a data modeling and query language designed for agents. Agents perform better with GSQL than both regular SQL and traditional BI APIs.
Read more → GSQL Model
table orders (
  id BIGINT -- Primary key
  user_id BIGINT
  created_at DATETIME
  status STRING -- One of 'Processing', 'Shipped', 'Complete', 'Returned'
  amount FLOAT -- Amount paid by customer
  cost FLOAT -- Cost of materials

  join one users on user_id = users.id

  revenue: sum(case when status <> 'Returned' then amount else 0 end)
  cogs: sum(case when status <> 'Returned' then cost else 0 end)
  profit: revenue - cogs
  profit_margin: profit / revenue
)

table users (
  id BIGINT -- Primary key
  email VARCHAR
  country_code VARCHAR
)
GSQL Query
select users.country_code,  -- Join is implied via the model
  profit_margin,            -- Invoke modeled measures
  avg(amount) as aov
from orders
Compiled SQL
select users.country_code,
  (
    sum(case when status <> 'Returned' then amount else 0 end)
    - sum(case when status <> 'Returned' then cost else 0 end)
  )
  / sum(case when status <> 'Returned' then amount else 0 end)
    as profit_margin,
  avg(amount) as aov
from orders
left join users on orders.user_id = users.id
group by 1
GSQL Model
table orders (
  id BIGINT -- Primary key
  user_id BIGINT
  created_at DATETIME
  status STRING -- One of 'Processing', 'Shipped', 'Complete', 'Returned'
  amount FLOAT -- Amount paid by customer
  cost FLOAT -- Cost of materials

  join one users on user_id = users.id

  revenue: sum(case when status <> 'Returned' then amount else 0 end)
  cogs: sum(case when status <> 'Returned' then cost else 0 end)
  profit: revenue - cogs
  profit_margin: profit / revenue
)

table users (
  id BIGINT -- Primary key
  email VARCHAR
  country_code VARCHAR
)
GSQL Query
select users.country_code,  -- Join is implied via the model
  profit_margin,            -- Invoke modeled measures
  avg(amount) as aov
from orders
Compiled SQL
select users.country_code,
  (
    sum(case when status <> 'Returned' then amount else 0 end)
    - sum(case when status <> 'Returned' then cost else 0 end)
  )
  / sum(case when status <> 'Returned' then amount else 0 end)
    as profit_margin,
  avg(amount) as aov
from orders
left join users on orders.user_id = users.id
group by 1
Try Graphene
Run the demo
Clone our example project and ask your coding agent a question about flight data.
Pilot Graphene Cloud
Pilot our new Slack agent, MCP server, and web app in close partnership with our team.